Sunday, 9 July 2023

Tableau Relationships | How Tableau Relationships Helped us Implement an OR Filter?

Scenario

We had a use case to implement an OR Filter in the Tableau reports.

How did we Solve it?

We used relationships to achieve this. I would like to explain this with an example.

Dataset for the Use Case

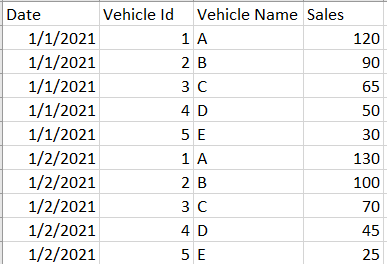
Consider the below data. It has daily sales by vehicle name. This dataset has vehicle name as A,B,C,D and E. 

Main Dataset


Assume, your organization had an old list of vehicles that your management people are more familiar to it and would want to see that list only, as filter on the reports. Assume, below is the old list of name of vehicles. For example, current day vehicle A was known as A LXI, A VXI, A DXI, which are now all known as only A. Similarly, others.

Old list of vehicles


User wants to see the Vehicle filter with the list of old values rather than new values. But the data that you return will be based upon the new list of vehicle name.

Example, regardless of user selecting A LXI,A VXI,A DXI, you should show the below data


Relationships to Rescue

1. Prepare the dataset as shown below, Main Dataset and Old List of Vehicles will be in relation based upon the Vehicle ID field and ensure it is Many to Many relation (default set by Tableau). No human intervention in this.


2. Go to sheet and do the below,
  1. Bring the fields from the Main Dataset into the view as shown below
  2. For the purpose of filter, use the vehicle name filter from the Old List of Vehicles. This is where, OR will be implemented.
Your view will appear something as shown below.


Now, observe the filtering behavior, You select A LXI OR A VXI OR A DXI, your view would always return the A vehicle data.

   Output, with different filter selection


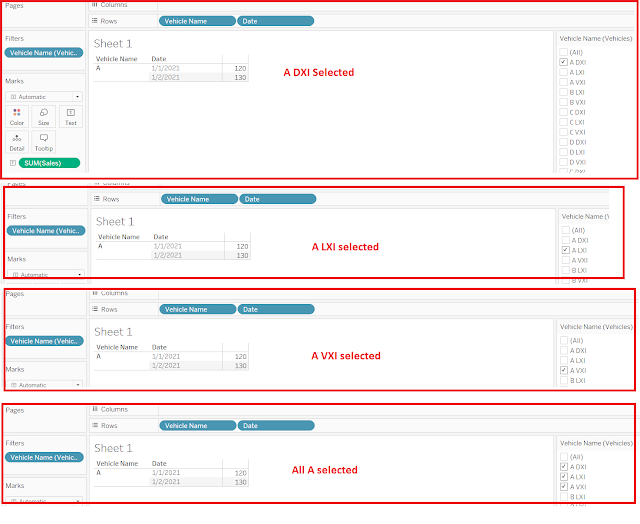
Don't you think this is the OR behavior one would expect?

How did this work? 

Tableau relationships are different from Join. Had, it been a join, then records would have always duplicated regardless of you use Vehicle Name field from the Old List of Vehicles in the view or outside the view but relationship, filters the duplicates unless the field from the non-fact table is consumed inside the view. Relationship are driven based upon cardinality, referential integrity and usage of fields from the related tables/dimensions.


Potential Issue : If you are already a master of relationships in Tableau, then you can ignore this, otherwise you should definitely read it. 

Ensure, you use the fields from the Old List of Vehicles, only for the purpose of filtering or in parameters, As long as they are away from the View, Tableau doesn't duplicate the records and on this one single feature of of relationship, OR filtering is implemented.

See below, what happens, if you use the field from the Old List of Vehicles dataset. Your data gets multiplied based upon the number of occurrences of joining records in the Old List of Vehicles.


My Comment on the Use Case used in this Blog

You may consider, the use case I have explained is trivial and may be non-realistic but think from the perspective of How filtering is implemented and in case if you have any such scenario, whether this solution works.

Alternate Approach

You could use this old list of vehicles in a separate dataset and through parameters, you can implement this filter. While this article is being written, Tableau doesn't support multi-select parameters by native feature so you have to implement multi-select parameters through calculations, which is achievable. That approach, I will share later. But it is not feasible, if you have multiple such filters like imagine, 4 filters or 5 filters are this way.

Monday, 19 June 2023

SQL | Basics, but tricky scenarios, to refresh your knowledge.

 If you have lost SQL touch, considering the continuous transformation that is happening across software industry (Data Warehouse and Business Intelligence) with the introduction of self service BI tools and advanced ETL tools, then here are some basic SQL scenarios that will definitely brush-up your SQL. Consider answering them on your own before you look at the solution. You may definitely have a better approach for the solutions provided, I'm just sharing my solutions.

Disclaimer : Below questions are not my own creations but are the ones asked to me by SQL experts. Solutions are mine.

  1. Consider below table, can you get the percentage of products that are both low fat and recyclable ?
/*
CREATE TABLE products (	product_id INT,
brand_name VARCHAR(100),
product_name VARCHAR (100),
is_low_fat_flg BIT,
is_recyclabl e_flg BIT
)


INSERT INTO products VALUES
 (1,NULL,'A',1,1),
 (1,NULL,'B',1,1),
 (1,NULL,'C',1,1),
 (1,NULL,'D',1,0),
 (1,NULL,'E',1,1),
 (1,NULL,'F',0,1),
 (1,NULL,'G',1,1),
 (1,NULL,'H',1,0),
 (1,NULL,'I',1,1),
 (1,NULL,'J',0,1),
 (1,NULL,'K',1,1),
 (1,NULL,'L',1,1),
 (1,NULL,'M',0,0),
 (1,NULL,'N',1,1),
 (1,NULL,'O',1,1),
 (1,NULL,'P',0,1),
 (1,NULL,'Q',1,1),
 (1,NULL,'R',1,1),
 (1,NULL,'S',1,0),
 (1,NULL,'T',0,1),
 (1,NULL,'U',1,1),
 (1,NULL,'V',1,1),
 (1,NULL,'W',1,1),
 (1,NULL,'X',0,0),
 (1,NULL,'Y',1,1),
 (1,NULL,'Z',1,1)
 */
--  SQL
 SELECT CAST(SUM(IIF(is_low_fat_flg = 1 and is_recyclable_flg = 1,1,NULL)) AS FLOAT) / COUNT(*)
 FROM products

2. Consider below the table, get the difference of sales of apple and orange at date level.


 /*
 CREATE TABLE fruit_sales (dateid DATE, fruit VARCHAR(50), sold DECIMAL)

 INSERT INTO fruit_sales VALUES
 ('2015-01-01'  ,'Apple' ,31 ),
 ('2015-01-01'  ,'Orange'  ,  19 ),
 ('2015-01-02'  ,'Apple'   ,  37 ),
 ('2015-01-02'  ,'Orange'  ,  26 ),
 ('2015-01-03'  ,'Apple'   ,  21 ),
 ('2015-01-03'  ,'Orange'  ,  21 ),
 ('2015-01-04'  ,'Apple'  ,  35 ), 
 ('2015-01-04'  ,'Orange'  ,  27)

 */

-- SQL

 SELECT dateid, ABS(SUM(IIF(fruit = 'Apple',sold,NULL)) - SUM(IIF(fruit = 'Orange',sold,NULL)))
 FROM fruit_sales
 GROUP BY dateid

3. Consider below the table, write a query that shows the US and France sales, by date. Grain is 1 row/day.

 /*
 CREATE TABLE country_sales(dateid   DATE, country VARCHAR(2), amt DECIMAL )
 INSERT INTO country_sales VALUES
( '2013-01-01' , 'US' ,         5 ) ,
( '2013-01-02', 'US' ,        8  ),
( '2013-01-03' , 'US' ,        10  ),
( '2013-01-01' , 'FR' ,         6  ),
( '2013-01-02' , 'FR' ,         6  ),
( '2013-01-05' , 'FR' ,         7  ),
( '2013-01-08' , 'GB' ,        10  ),
( '2013-01-01' , 'FB' ,         5  ),
( '2013-01-06' , 'JP' ,         8  ),
( '2013-01-07' , 'JP' ,         8 )
*/

-- SQL
SELECT dateid,country,SUM(amt)
FROM country_sales
WHERE country IN ('US','FR')
GROUP BY dateid, country

-- check what happens if you use the below code

SELECT dateid,SUM(IIF(country = 'US',amt,NULL)),SUM(IIF(country = 'FR',amt,NULL))
FROM country_sales
WHERE country IN ('US','FR')
GROUP BY dateid

4. Consider below the table, write a query to get the students who have borrowed at least 5 books.

/*
CREATE TABLE Students(Stid INT, Sname VARCHAR(50))
CREATE TABLE BooksBorrowed(Bid INT,Stid INT, BookName VARCHAR(100))

INSERT INTO Students VALUES
(1,'A'),
(2,'B'),
(3,'C'),
(4,'D'),
(5,'E'),
(6,'F'),
(7,'G'),
(8,'H'),
(9,'I'),
(10,'J'),
(11,'K'),
(12,'L'),
(13,'M'),
(14,'N'),
(15,'O'),
(16,'P'),
(17,'Q'),
(18,'R'),
(19,'S'),
(20,'T'),
(21,'U'),
(22,'V'),
(23,'W'),
(24,'X'),
(25,'Y'),
(26,'Z')


INSERT INTO BooksBorrowed VALUES
(1,1,'Book1'),
(2,3,'Book2'),
(3,5,'Book3'),
(4,7,'Book4'),
(5,9,'Book5'),
(6,11,'Book6'),
(7,1,'Book7'),
(8,3,'Book8'),
(9,7,'Book9'),
(10,9,'Book9'),
(11,11,'Book8'),
(12,2,'Book7'),
(13,4,'Book6'),
(14,6,'Book5'),
(15,1,'Book4'),
(16,1,'Book3'),
(17,3,'Book2'),
(18,3,'Book1'),
(19,3,'Book5'),
(20,9,'Book6'),
(21,9,'Book7'),
(22,9,'Book8'),
(23,12,'Book9'),
(24,14,'Book1'),
(25,16,'Book2'),
(26,18,'Book3'),
(27,18,'Book4'),
(28,12,'Book6'),
(29,14,'Book8'),
(30,14,'Book4'),
(31,16,'Book3'),
(32,18,'Book7'),
(33,14,'Book3'),
(34,12,'Book6'),
(35,12,'Book7'),
(36,16,'Book8'),
(37,16,'Book2'),
(38,16,'Book1')
*/

-- SQL

SELECT S.Sname,B.*
FROM Students S INNER JOIN
(SELECT Stid,count(bid) TotalBooksBorowed
FROM BooksBorrowed
GROUP BY Stid
HAVING COUNT(*)>=5) B
	ON S.Stid = B.Stid

5. Use the above schema and get the students who have barrowed no books

SELECT S.stid,S.Sname,B.stid
FROM Students S 
LEFT JOIN BooksBorrowed B
ON S.Stid = B.Stid
WHERE B.Stid IS NULL

6. Use the above code and get the students who have borrowed least number of books. I have not provided solution for this question.

7. Consider the below code and Get the average sales by given month

/*
CREATE TABLE Items (ItemId VARCHAR(10),StartDate DATE,EndDate DATE,Price DECIMAL)
INSERT INTO Items VALUES
('mobile','2020-01-01','2020-01-15',100),
('mobile','2020-01-16','2020-01-20',150)

CREATE TABLE Sales(Saleid INT,ItemId VARCHAR(10),PurchaseDate DATE,Quantity INT)
INSERT INTO Sales VALUES
(100,'mobile','2020-01-05',100),
(101,'mobile','2020-01-17',200)

SELECT * FROM Items
SELECT * FROM Sales
*/

--SQL
--  Get the average sales by given month

SELECT MONTH(PurchaseDate), SUM(S.quantity * I.Price)/COUNT(*) TotalAmount
FROM Sales S
INNER JOIN Items I 
	ON S.ItemId = I.ItemId AND PurchaseDate BETWEEN I.StartDate AND I.EndDate
GROUP BY MONTH(PurchaseDate)

Please do leave comments below, if you see this post as helpful or if there are any issues with the solutions provided.

Tableau | Password Protected Dashboard

 Let’s develop simple password protected tableau dashboard. This dashboard accepts UserID and Pin from user and shows data only after authenticating user. This implementation involves very basic mechanics as main intention of the post is to educate how to implement userid and password protection for dashboards.  Following are the steps to do this,

  1. Store UserIds and Pins in a master table. Here table variable is used.
  2. Take UserId and Pin from user through dashboard parameter
  3. Pass these parameters to SQL Server database stored procedure
  4. Stored procedure authenticates user and returns data accordingly.

Before we begin the post, it is assumed that the reader is aware of following things

  1. Basic understanding of Tableau, Connecting to data source from Tableau
  2. Calling stored procedures from Tableau
  3. SQL Server Stored Procedures
  4. Parameters in Tableau


  1. Develop simple SQL procedures that returns data after authenticating userid and pin

Following is the SP developed for this post. This SP takes user id & pin from user and returns Customer details if authentication is successful. Otherwise no data is displayed.

CREATE PROCEDURE Sp_tableaupwdsecureddashboard(@UserID VARCHAR(4) = NULL, @Pin    VARCHAR(4) = NULL)
AS
BEGIN
SET nocount ON

-- Master Table with UserIds and Pwds
DECLARE @Users TABLE
(
userid VARCHAR(10),
pin    VARCHAR(4)
)

INSERT INTO @Users
VALUES      ('East',
'1234'),
('West',
'5678'),
('North',
'2222')

-- Validate Userid & Pin and then return the result
IF (SELECT Count(*)
FROM   @Users
WHERE  userid = @UserID
AND pin = @Pin) > 0
BEGIN
SELECT [CustomerName] = C.firstname + ' ' + Isnull(C.middlename, '')
+
' '
+ Isnull(C.lastname, ''),
C.birthdate,
C.gender,
C.yearlyincome,
[CustomerAddress] = C.addressline1 + ' '
+ Isnull(C.addressline2, ''),
C.phone,
C.emailaddress
FROM   [AdventureWorksDW2012].[dbo].[dimcustomer] C
END
-- Return blank set
ELSE
BEGIN
SELECT [CustomerName] = C.firstname + ' ' + Isnull(C.middlename, '')
+
' '
+ Isnull(C.lastname, ''),
C.birthdate,
C.gender,
C.yearlyincome,
[CustomerAddress] = C.addressline1 + ' '
+ Isnull(C.addressline2, ''),
C.phone,
C.emailaddress
FROM   [AdventureWorksDW2012].[dbo].[dimcustomer] C
WHERE  1 = 0
END
END

2. Open Tableau Desktop and connect to the server and database where this SP is deployed.

2


3. Take New sheet and create two parameters UserId and Pin as shown below

UserId

3.1

Pin

3.2

4. In data source connection, connect to the SP developed for this dashboard,

Connect to the SP and map the parameters created.

4


5. Go to sheet and show UserId and Pin parameters. Create simple view as shown below. Enter Valid UserId and Pin in the parameters. If userid and pin are valid, then data is displayed.

5


6. No data is shown for invalid userid and password

6

Please let know if there are any simple ways of achieving this. Will try to post this workbook to tableau public and update the link here shortly.

Tableau | Code Dirty | Show/Hide Multiple Parameters based upon another Parameter

 Hi

You might have come across a requirement while working on Tableau, where you are required to show/hide parameters based upon another parameter. In this blog, I would like to show, how to hide multiple parameters dynamically.

Requirement : I have four parameters, Geography, Region, State and City. Geography parameter will have values as 'Region', 'State', 'City'. If Region is selected in the Geography parameter, then only Region Parameter should be shown to the user and rest two (State and City) should be hidden. Similarly, if City is selected in Geography parameter, then hide State and Region parameters.

This is how parameters look like (I'm using Tableau's Sample Super Store dataset)

Geography

Geography parameter

Region

Region Parameter

State

State parameter

City

City Parameter

Solution: In short, solution is to place the parameters to show or hide (Region, State, City) in a horizontal container and make them move left/right based upon the selected parameter value (Geography). To achieve the movements, use sheets.

  1. Create a calculated field Geography Filter, that holds Geography parameter values. This will be used in the sheets that will create parameter movement.
  1. Create four sheets, LHS, LHS1, RHS, RHS1 as shown below. Observe the parameter values to be selected in each of the sheet. At any point of time, out of four sheets, only two will be active.
  2. LHS : Create a sheet, LHS, and apply Geography filter by selecting Region and add a dummy header like "" in rows

3. Duplicate LHS and create LHS1. Here set Geography Filter to Region and State and add a dummy header like "" in rows

4. Duplicate LHS and rename it to RHS. Set Geography Filter to State and City and add a dummy header like "" in rows

5. Duplicate RHS and rename it to RHS1. Set geography filter to City only and a dummy header like "" in rows

6. Take new dashboard and add a horizontal container. Add the three parameters, Region, State & City and add the four sheets created as shown below in the same order. Order is important here.

8. Size of the container is also important. For example, I'm using the parameters width as 100 pixels in my dashboard. So, the 3 parameters' width will be set to 100 pixels each (fixed) and will add 200 pixels more to the container for the sheets to make the movement, taking the container width to 500 pixels, as sown below. Remember, at any given point of time, only two sheets will be active.

Format the sheets properly, hide titles, remove borders, add the dummy header, make it full screen. In short, follow all the rules of sheet toggling in Tableau

8. Bring the Geography parameter to the dashboard, hide the tile of each sheet (LHS/1, RHS/1) and see the parameter making the movements.

if region is selected in Geography, look at the position of Region parameter.

if State is selected in Geography, look at the position of State parameter, it has taken the position of Region parameter.

If I do some formatting and place white blank objects on the right and left hand side on the horizontal container and just show one parameter, in this case, only state will be shown in the view and everything will be behind the blanks,

State

City

Format further and see now

Will try to post it on gallery and share the link here, soon. if you think it is helpful, then please leave a comment, otherwise let me know of doing this in a better way.

Tableau | 4 or N Months Rolling Sales Example Without Tableau Calculations

Before you read : Method used in the post is through calculated fields. You can achieve the same using Table calculation with few clicks, but this way of writing will make you create dynamic Rolling Sales like 4 months, 3 months, 2 months as per user requirement which Tableau doesn't support - at least until the time this blog is written.

Requirement : Using Tableau, show 4 months rolling sales until previous or last closing month. For example, if current month is Sept 2021, then you are requested to show rolling sales from May 2021 to Aug 2021.

  1. May-21 should show sales from Feb-21 until May-21
  2. Jun-21 should show sales from Mar-21 until Jun-21
  3. Jul-21 should show sales from Apr-21 until Jul-21
  4. Aug-21 should show sales from May-21 until Aug-21

Dataset : I will be using sample super store dataset provided by Tableau

1. Bring last 7 months of data in the view. As I have to show 4 months rolling, I need current 4 months and previous 3 months of data.

4 months rolling date filter
// Since we are calculating 4 months rolling, load view with data from last 7 months
DATETRUNC('month',[Order Date])>= DATEADD('month',-7,DATETRUNC('month',TODAY())) 
AND
DATETRUNC('month',[Order Date])< DATETRUNC('month',TODAY()) // Untill Last Month

2. Rank the months in ascending order. Here, I use Order Date as date column

Rank Order Date (ascending)
RANK_DENSE(MAX([Order Date]),'asc')

3. Create view as shown below

4. Observe the ranks created for each month and pick the data for current four months i.e May-21. Jun-21, Jul-21, Aug-21. Rolling Sales for the month of May-21 will be Running Total from Rank 1 to Rank 4 i.e Feb-21 to May21. Similarly, for Jul-21, Rolling sales will be Running Total from Rank 3 to Rank 6. You end up creating below logic,

Below part of code, you will have to replicate to make it dynamic based upon l4 months, 3 months, 2 months etc.

4 Months Rolling Sales 
IF [Rank Order Date (ascending)] = 4 
    THEN RUNNING_SUM(IF  [Rank Order Date (ascending)]>=1 
    AND [Rank Order Date (ascending)]<=4 THEN SUM([Sales]) END ) 
//Jun
ELSEIF [Rank Order Date (ascending)] = 5 
    THEN RUNNING_SUM(IF  [Rank Order Date (ascending)]>=2 
    AND [Rank Order Date (ascending)]<=5 THEN SUM([Sales]) END )
// Jul
ELSEIF [Rank Order Date (ascending)] = 6 
    THEN RUNNING_SUM(IF  [Rank Order Date (ascending)]>=3 
    AND [Rank Order Date (ascending)]<=6 THEN SUM([Sales]) END )
//Aug
ELSEIF [Rank Order Date (ascending)] = 7 
    THEN RUNNING_SUM(IF  [Rank Order Date (ascending)]>=4 
    AND [Rank Order Date (ascending)]<=7 THEN SUM([Sales]) END )

END

5. Bring 4 Months Rolling Sales measure to view.

6. Remove the previous 3 months from the view using another rank filter. Select only the months with rank 4 or more because we are showing last four months rolling sales. Apply this filter in the new

4 Months Rolling Rank Filer
[Rank Order Date (ascending)]>=4

View is ready for use

This logic works dynamically for last four months because I have a dynamic date filter in the view. if you want to show last 5 months rolling sales, then you will have to include [(2*5)-1] = 9 months of data in the view and accordingly add one more if else condition to fetch rolling sales for one more month and adjust the rank range accordingly.

If you think this post is helpful or if there is any other better optimized way of doing this, then please let me know through comment.

Thank you.

Power BI | DAX | Convert SQL to DAX

 Hi

If you are new to DAX, then this post will help you compare DAX with SQL and get an overview of DAX. It is assumed that the reader is aware of SQL (basics).

Consider the below tables that I have taken from Tableau's Sample Super Store dataset. You can download this data set from Tableau site or search Tableau Sample Super Store data set. It is an excel.

I would like to get all the orders from the city 'Los Angeles' and the people who have ordered them. From RDBMS querying perspective, my SQL would look something like this

SELECT  O.OrderID [City_OrderID]
	   ,O.OrderDate [City_OrderDate]
	   ,O.Sales [City_Slaes]
	   ,O.Profit [City_Profit]
	   ,O.Quantity [City_Quantity]
	   ,O.Region [City_Region]
	   ,P.Person [Person]
FROM Orders O
INNER JOIN People P ON O.Region = P.Region
WHERE City = 'Los Angeles'

How would you write a DAX query to get the same results as above from a Power BI data set? Below is the DAX

OrdersByCity = 
 SELECTCOLUMNS(FILTER(GENERATE(Orders,People),Orders[Region] 
                    = People[Region] && Orders[City] = "Los Angeles")
                               ,"OrderID",Orders[Order ID]
                               ,"OrderDate",Orders[Order Date]
                               ,"Sales",Orders[Sales]
                               ,"Profit",Orders[Profit]
                               ,"Quantity",Orders[Quantity]
                               ,"City_Region",Orders[Region]
                               ,"Person",People[Person])

Output from Power BI

GENERATE is a JOIN, FILTER is a WHERE clause, SELECTCOLUMNS is a SELECT clause

I have written this post to make a comparison between SQL and DAX querying. In case if you are new to DAX, like me, then it may help you in getting started, if you have little bit of SQL background.

-Yadnesh Madiwale

Tableau | Code Dirty | Row Level Coloring in a Crosstab

 Problem : You are asked to show sales by category for last 5 months in a crosstab and color each cell at row level. Meaning, coloring should happen for each category independently and not at the table level.

Solution : I have one possible solution that will solve your problem. I have used Tableau Super Store dataset to explain the solution.

Steps :

Create a crosstab as shown below that shows Sales by Category for the 5 months. Color the cells based upon Sales and use Custom Diverging option. If you notice, coloring is at table level.

Create the below calculated field. It is a table calculation execution at row level that creates a scale of 1 to 100% for each row based upon maximum and minimum values in that row.

Row Level Color

IF SUM([Sales]) = WINDOW_MIN(SUM([Sales])) THEN 1 // minimum value = 1%
ELSEIF SUM([Sales]) = WINDOW_MEDIAN(SUM([Sales])) THEN 50 // Middle value = 50%
ELSEIF SUM([Sales]) < WINDOW_MEDIAN(SUM([Sales])) 
THEN (SUM([Sales])/(WINDOW_MAX(SUM([Sales])) + WINDOW_MEDIAN(SUM([Sales]))))*100 
ELSE (SUM([Sales]) / WINDOW_MAX(SUM([Sales]))) * 100
END

Place the above field on color palette and make the table calculation of Row Level Color 'Compute Across'.

See below, the coloring now is at row level. The example I have shown, best works with odd number of values as I have used Median. You can fine tune the code and come up with a better approach. Please do let me know if this solution has helped you or if you have any better solution than this.

Tableau vs Power BI | Fact Constellation Data Model Case Study

Hello Everyone

There is a use case to model the data at the reporting tool level which involves two different Fact tables that have some common dimensions and some dimensions specific to each Fact. So I have to create a Fact Constellation data model at reporting level. Primary tool for the requirement is Tableau but since, I was unable to achieve this using Tableau and I tried exploring the same with Power BI which seems to be possible there.

Use Case : Consider a dataset of an Organization, ABC. With organization there will be Headcount (total employees in an organization) and Exits (employees leaving the organization, which could be Voluntarily, Involuntary, Internal Transfer or Contingent Exits)

Some dimensions you can think of are Date, Location, ExitType (this tells what kind of exit, the employee has taken which means, Voluntarily, Involuntary etc.)

If you think of Facts and Dimensions, then these are the ones

  1. Fact_Headcount
  2. Fact_Exits
  3. Dim_Location
  4. Dim_Date
  5. Dim_ExitType

The common dimensions between the Headcount and Exits will be Dim_Date & Dim_Location. Dim_ExitType is a specific dimension for Fact_Exits.

You can question, why we are not having a single fact table for headcount and exits and the answer would be, Exit% is reported as [Exits / Total Headcount] and this analysis is done using the ExitType dimensions. Like Voluntary Exit%, Involuntary Exit% etc. If both, the Headcount and Exits are maintained in the same table, then slicing the Headcount and Exits would be challenging using the ExitType dimension. If you select any particular exit type, then records will be shown only for that exit type and the rest of the total headcount will be filtered out, Then how to get the Exit%?

Reporting Requirement: Business needs a report that shows trend lines showing the Voluntary Exit% (VE), Involuntary Exit% (IVE), Internal Transfer% (IF) etc using Tableau. These trends can be YTD, QTD, MTD, Last Thirteen Months, 12 Months Rolling etc. Now these are the solutions I can think of

  1. Approach 1 : Get a single table from the data source that has all the information of Headcount and Exits and write individual measures for VE, IVE and IF and show on the report. But, imagine, you have 10 exit types, or a new exit type gets added or you have to show a crosstab with grand total as well. All these things become difficult to manage if we go in this direction. Otherwise, use Exclude LOD (it also has a limitation).
  2. Approach 2: Data Model : If we model our data by separating Headcount and Exits and create a fact constellation model, then ExitType dimension will act only upon the Exits and will not filter the Headcount, solving our slicing issue. So how would the model look like?

What I'm trying to say is, the above model can be created in Power BI (it is actually a screenshot from Power BI) but creating the similar model using Tableau Data Model is not possible unless you combine the Headcount and Exits into single table through UNION or any other technique and then use in that way. But, that doesn't seem be an ideal solution here considering again filtering the facts becomes an obstacle.

So, as of today, (when this blog is written, 05th March 2023), Tableau doesn't support having two facts in its logical model (Using Relationships).

If you have any solutions, then please suggest me.

Why Approach 1 Explained above will not work?

-Yadnesh Madiwale

  1. Writing individual measures for each exit type? Assume if you have to show the trend for 10 Exit type or if you have another 15 sub-category of Exits for which you have to trend, will it be manageable to having these many measures? Another issue with this approach is, if you create a crosstab, then how will you show the grand total? It at least cannot be shown in the same crosstab, you have to maintain a separate sheet for grand total, always.
  2. Exclude LOD? It works fine as long as long there is a record available for the exit type for each month, otherwise, it fails and doesn't return correct results in case of QTD or YTD or 12 months rolling. You can do data densification/scaffolding, but that doesn't seem to help either.