Problem : You are asked to show sales by category for last 5 months in a crosstab and color each cell at row level. Meaning, coloring should happen for each category independently and not at the table level.
Solution : I have one possible solution that will solve your problem. I have used Tableau Super Store dataset to explain the solution.
Steps :
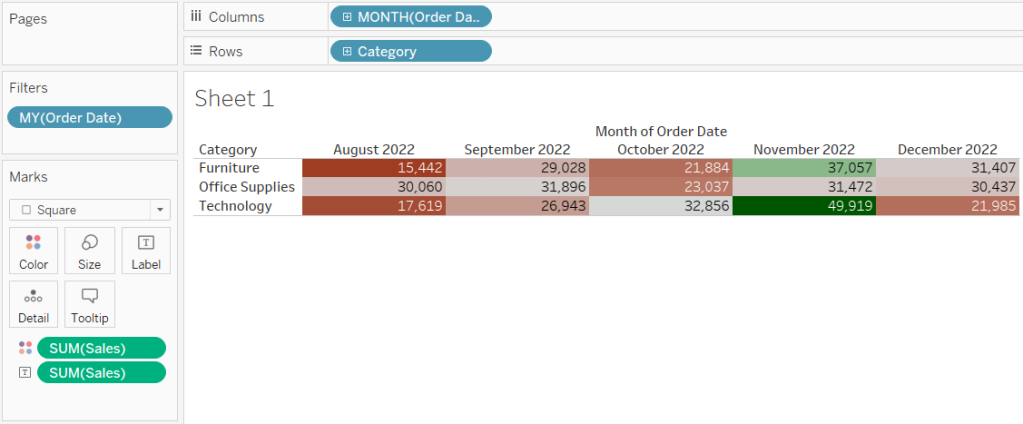
Create a crosstab as shown below that shows Sales by Category for the 5 months. Color the cells based upon Sales and use Custom Diverging option. If you notice, coloring is at table level.
Create the below calculated field. It is a table calculation execution at row level that creates a scale of 1 to 100% for each row based upon maximum and minimum values in that row.
Row Level Color

IF SUM([Sales]) = WINDOW_MIN(SUM([Sales])) THEN 1 // minimum value = 1%
ELSEIF SUM([Sales]) = WINDOW_MEDIAN(SUM([Sales])) THEN 50 // Middle value = 50%
ELSEIF SUM([Sales]) < WINDOW_MEDIAN(SUM([Sales]))
THEN (SUM([Sales])/(WINDOW_MAX(SUM([Sales])) + WINDOW_MEDIAN(SUM([Sales]))))*100
ELSE (SUM([Sales]) / WINDOW_MAX(SUM([Sales]))) * 100
END
Place the above field on color palette and make the table calculation of Row Level Color 'Compute Across'.
See below, the coloring now is at row level. The example I have shown, best works with odd number of values as I have used Median. You can fine tune the code and come up with a better approach. Please do let me know if this solution has helped you or if you have any better solution than this.

No comments:
Post a Comment